 1
 2
 3
 4
 5
 6
 7
 8
 9
10
11
12
13
14
15
16
17
18
19
20
21
22
23
24
25
26
27
28
29
30
31
32
33
34
35
36
37
38
39
40
41
42
43
44
45
46
47
48
49
50
51
52
53
54
55
56
57
58
59
60
61
62
63
64
65
66
67
68
69
70
71
72
73
74
75
76
77
78
79
80
81
82
83
84
85
86
87
88
89
90
91
92
93
94
95
96
97
98
99
100
101
102
103
104
105
106
107
108
109
110
111
112
113
114
115
116
117
118
119
120
121
122
123
124
| import re
import sys
import pandas as pd
import locale
import matplotlib.ticker as mticker
from PySide6.QtCore import Qt, Slot, QTimer
from PySide6.QtWidgets import QMainWindow, QApplication, QVBoxLayout, QHBoxLayout, QWidget, QSlider, QComboBox
from matplotlib.backends.backend_qtagg import FigureCanvasQTAgg
from matplotlib.figure import Figure
figure = Figure(figsize=(12, 6), dpi=90)
global cur_data_len, cur_major_locator
cur_data_len = 10 # 当前显示的数据量(显示10年的数据)
cur_major_locator = 10 # 当前刻度的定位器(主刻度)
pattern = re.compile('\((\S*)\)')
def getgdpvalue(gdpstr):
re_obj=pattern.search(gdpstr)
gdp_value=locale.atof(re_obj.group(1))/100000000
return gdp_value
class ApplicationWindow(QMainWindow):
def __init__(self, parent=None,org_data=None):
QMainWindow.__init__(self, parent)
self.axes = None
self.axis_china=None
self.axis_us=None
self.datacount=10
self.org_data = org_data
self.auto_offset = 0
# Central widget
self._main = QWidget()
self.setCentralWidget(self._main)
# Figure
self.canvas = FigureCanvasQTAgg(figure)
if len(self.org_data) > 0:
show_data = self.org_data[0:self.datacount]
self.axes = self.canvas.figure.subplots()
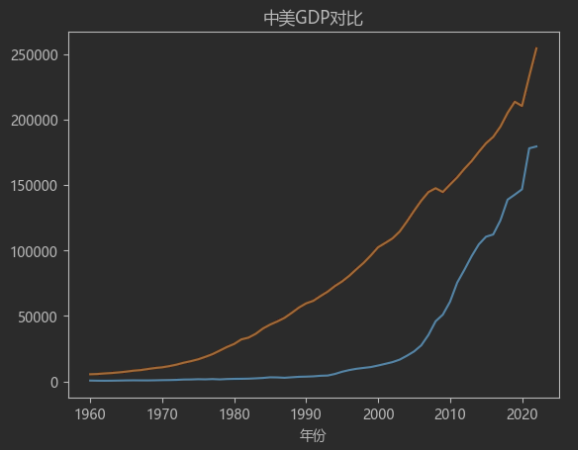
self.axes.set_title('中美GDP对比')
self.axis_china = self.axes.plot(show_data['年份'], show_data['china_gdp_value'], label='中国GDP')
self.axis_us = self.axes.plot(show_data['年份'], show_data['us_gdp_value'], label='美国GDP')
y_max = max(self.org_data['us_gdp_value'].max(), self.org_data['china_gdp_value'].max())
self.axes.set_ylabel('GDP(亿元)')
self.axes.set_xlabel('年份')
self.axes.set_ylim(0, y_max)
self.axes.set_xlim(show_data['年份'].min(), show_data['年份'].max())
self.axes.legend(loc="upper left")
self.axes.yaxis.set_major_locator(mticker.MultipleLocator(20000))
self.axes.xaxis.set_major_locator(mticker.MultipleLocator(1))
figure.tight_layout() # 自动调整子图参数,使之填充整个图像区域
# 下拉框,选择模式 # ComboBox (combo_type)
self.combo_type = QComboBox()
self.combo_type.addItems(['自动播放', '手动播放'])
# Sliders
min_value = 0
self.max_value = len(self.org_data)-cur_data_len
self.slider_update = QSlider(minimum=min_value, maximum=self.max_value, orientation=Qt.Horizontal) # 滑动条
layout1 = QHBoxLayout()
layout1.addWidget(self.combo_type)
# layout
layout2 = QVBoxLayout()
layout2.addWidget(self.canvas, 88)
layout2.addWidget(self.slider_update)
# Main layout
layout = QVBoxLayout(self._main)
layout.addLayout(layout1)
layout.addLayout(layout2, 100)
self.canvas.draw()
# Signal and Slots connections
self.combo_type.currentTextChanged.connect(self.selecttype)
self.slider_update.valueChanged.connect(self.update_frequency)
self.autoslider()
def autoslider(self):
self.timer = QTimer()
self.timer.setInterval(100) # 100毫秒更新一次数据
self.timer.timeout.connect(self.autoupdate) #自动更新数据,每次更新偏移量加1,也就是跳一年的数据
self.timer.start()
def autoupdate(self):
self.update_frequency(self.auto_offset)
self.slider_update.setSliderPosition(self.auto_offset)
if self.auto_offset < self.max_value:
self.auto_offset = self.auto_offset+1
else:
self.auto_offset = 0
@Slot()
def selecttype(self, text):
if '自动播放' == text:
self.autoslider()
elif '手动播放' == text:
self.timer.stop()
@Slot()
def update_frequency(self, new_val):
    # 偏移量每次偏移1
    f = int(new_val)
    offset = f + cur_data_len  # 偏移刻度
    show_data = self.org_data[f: offset]
    x = show_data['年份']
    y_china = show_data['china_gdp_value']
    y_us = show_data['us_gdp_value']
    self.axes.set_xlim(x.min(), x.max())
    self.axis_china[0].set_data(x, y_china)
    self.axis_us[0].set_data(x, y_us)
    self.canvas.draw()
if __name__ == "__main__":
app = QApplication(sys.argv)
locale.setlocale(locale.LC_ALL, 'en_US.UTF-8')
df_data = pd.read_excel('data\中国VS美国.xlsx')
df_data = df_data.loc[1:len(df_data)]
df_data['china_gdp_value'] = df_data['中国'].map(getgdpvalue)
df_data['us_gdp_value'] = df_data['美国'].map(getgdpvalue)
df_data = df_data.sort_values('年份')
w = ApplicationWindow(org_data=df_data)
w.setFixedSize(1000, 500)
w.show()
app.exec()
|